Research tools · Beta
Vaccine transcriptomic signatures
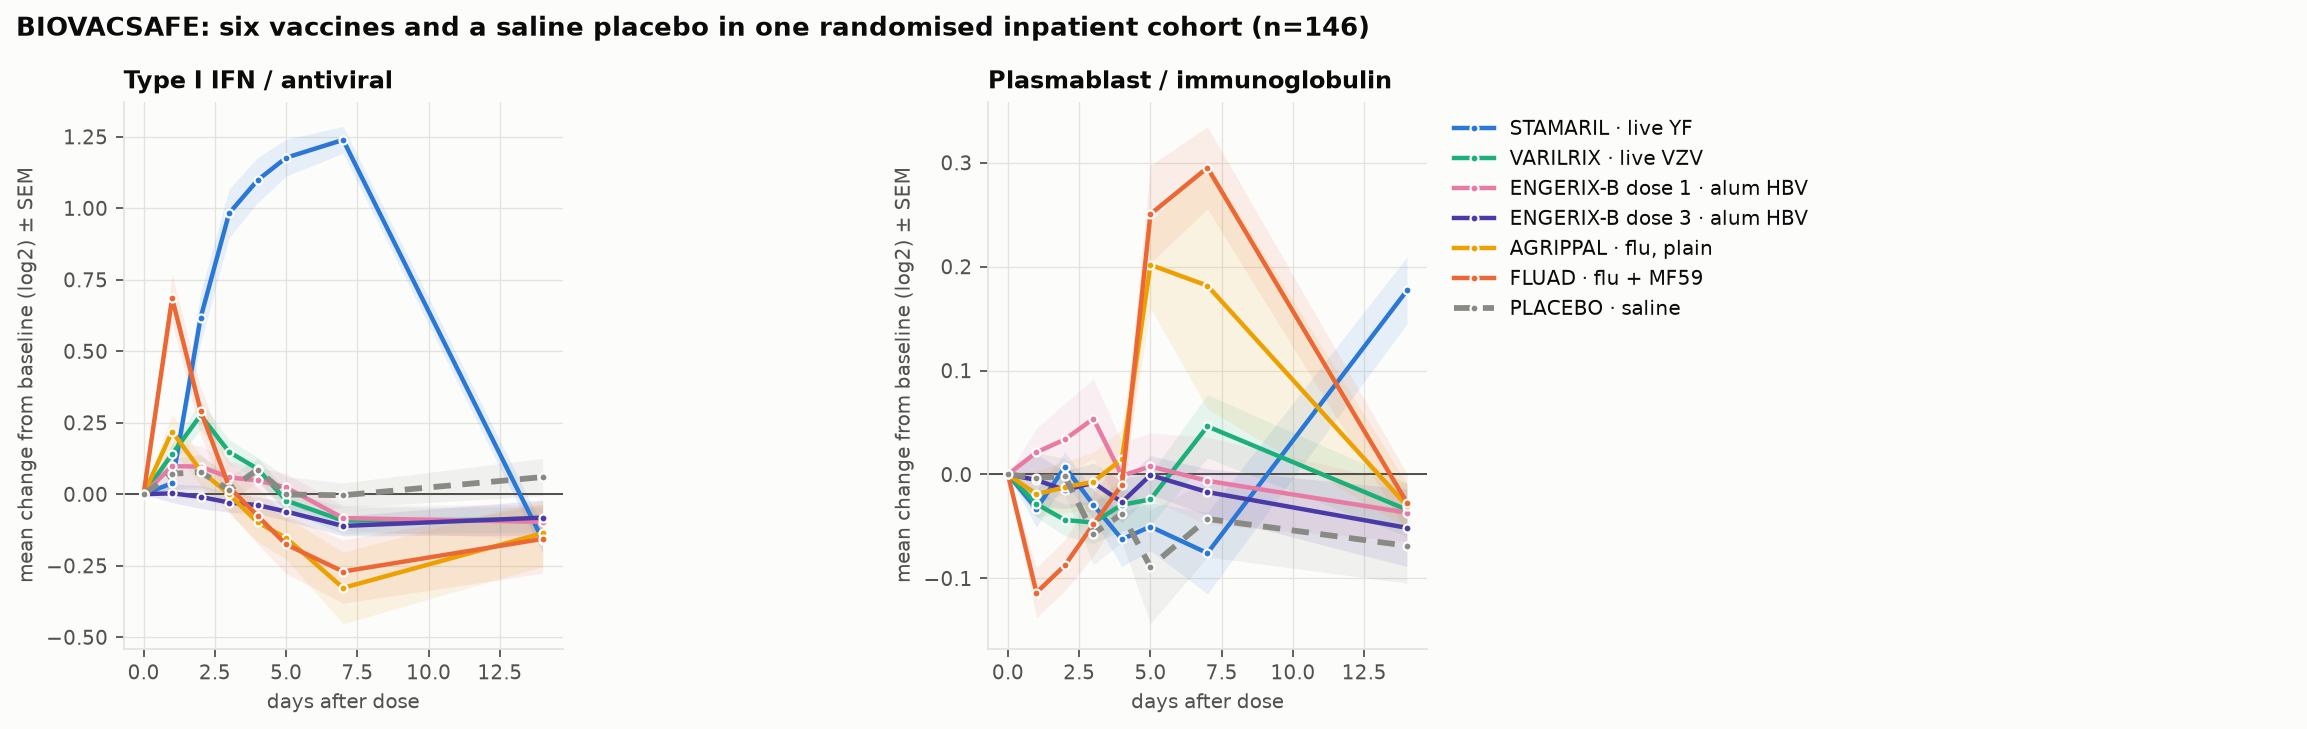
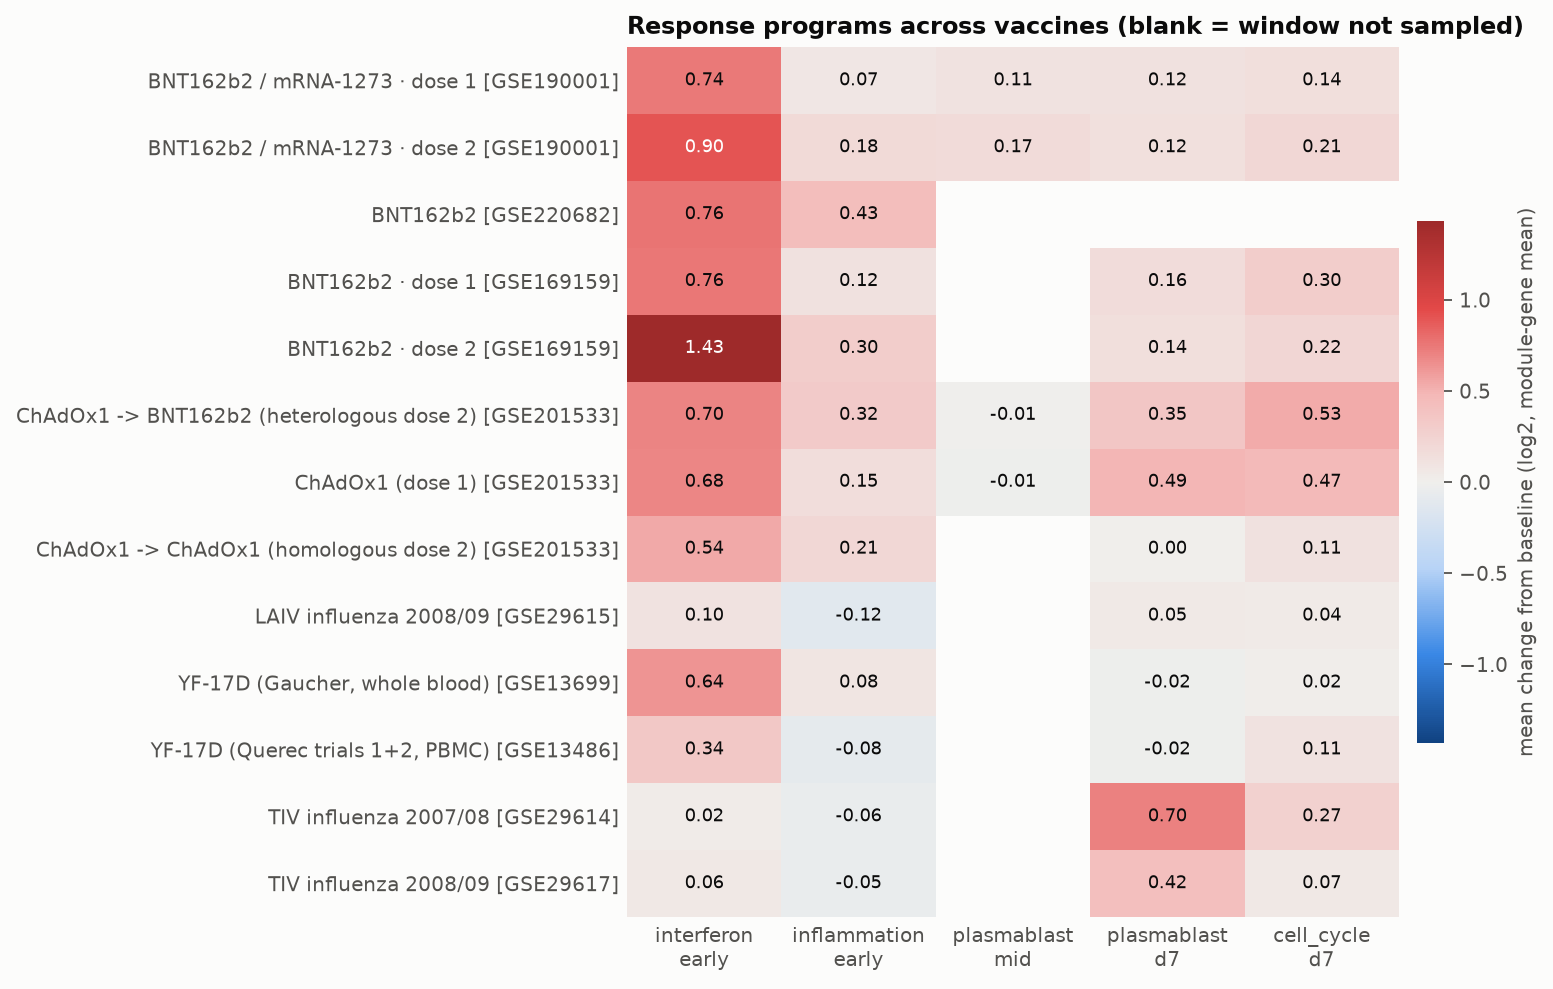
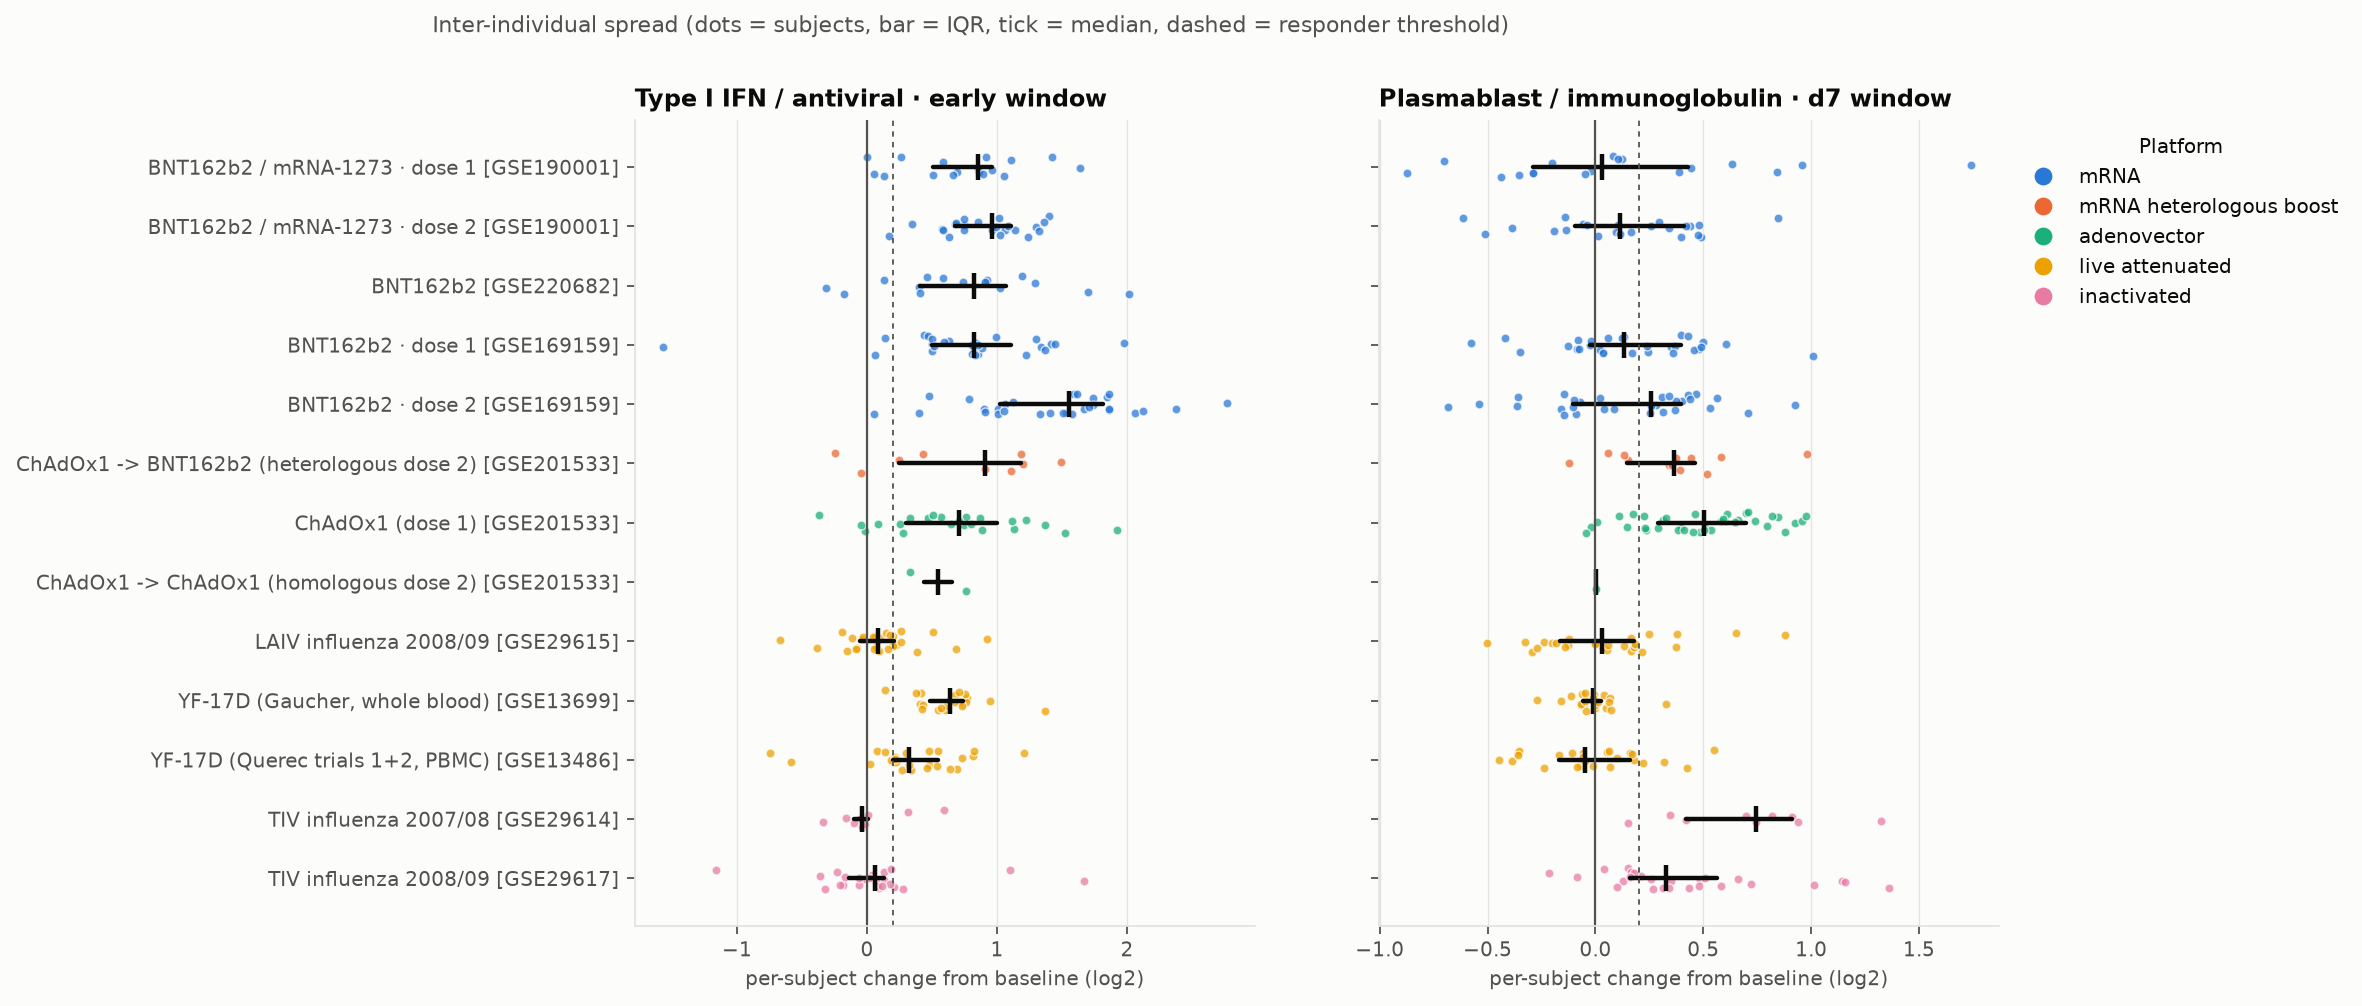
When a vaccine is given, the genes that immune cells switch on in the blood change over the following hours and days. Many vaccine studies have measured this and published the raw data in NCBI's Gene Expression Omnibus (GEO). This project downloads those public datasets, puts them all on one method, and asks two questions: do different vaccines produce different responses, and how much do responses differ between people.
What the reanalysis found
Key figures



Pre-registered test
To check whether finding 2 (replicating vs non-replicating timing) and finding 4 (the noise floor) hold up, two hypotheses were frozen with their analysis code, hashed, and registered on OSF before any held-out data was scored. They were then run once on datasets not used to generate them.
| Hypothesis | Pre-specified requirement | What the held-out data gave | Verdict |
|---|---|---|---|
| H1: interferon peaks early (day 1–2) after non-replicating vaccines and late (day 5+) after replicating exposures | at least 8 arms passing inclusion | 6 arms; non-replicating early 3/4, replicating late 2/2; Fisher p = 0.4 | Inconclusive |
| H2: the cross-study noise floor is at least |g| 0.8 with at least 15% of tests significant | at least 20 pairwise tests | 12 tests; 95th-percentile |g| = 1.01; 0% at FDR < 0.05 | Inconclusive |
Both point in the predicted direction, but too few held-out datasets met the inclusion rules to test them as registered, so neither is counted as confirmed. Results are reported as registered, including the exclusions.
Dataset browser
Every dataset in the project's catalog. Analysed means the pipeline has a recipe for it and it was downloaded and scored; the others are catalogued for future work. Status is as recorded in the source catalog (for example, holdout = reserved for the pre-registered test).
| Accession | Vaccine / exposure | Platform | Species · tissue | Assay | n | Status |
|---|---|---|---|---|---|---|
| Loading… | ||||||
Method in brief
- Audit. Every accession in the catalog was checked against live GEO, PubMed, BioStudies and ClinicalTrials.gov records; mismatches are flagged rather than silently used.
- Harmonise. RNA-seq counts become log2 CPM; microarrays use the submitters' normalised values; all gene identifiers are mapped to current HGNC symbols.
- Score. Each sample is scored on the Li et al. 2014 blood transcription modules, grouped into four programs: type I interferon, inflammation, plasmablast (antibody-producing cells) and cell cycle.
- Per person. Each response is a change from that person's own pre-dose sample, so differences between people at baseline cancel out.
- Compare. Vaccines are compared within one study where possible, and every cross-study difference is judged against the measured noise floor.
What this cannot tell you
- It is not a safety signal. An interferon or inflammation response is the immune system doing what a vaccine is designed to make it do. A larger response is not more harm, and a smaller one is not less protection (alum hepatitis B, which protects well, shows almost none).
- It is not linked to VAERS or other report systems. Those share no individuals with any expression dataset and have no denominator, so joining them would be an ecological comparison that readily produces large spurious associations. Outcomes are analysed only where they were recorded in the same people who were profiled.
- Small studies. Most datasets have 10–50 people, enough to detect large effects only.
- Blood is not the whole picture. Responses in lymph nodes or tissues can differ from what circulating cells show.
Data and code
Dataset table: datasets.json. Pre-registration: OSF 86t3u. The pipeline (vaxsig) reads only public GEO data and rebuilds every number here; all raw data stays with GEO. How this site handles pre-registration and corrections: research governance.
Beta. Analyses generated 2026-10-08 to 2026-10-09; pre-registered test run 2026-10-09; page updated 2026-10-14. Found an error? Report a correction.